Previous Examples
Previous examples (prior to 4.0) can be found on the previous examples page, but we discourage their use because they are now outdated.
![]()
Previous examples (prior to 4.0) can be found on the previous examples page, but we discourage their use because they are now outdated.
Search the online forum for your application, check out others' published pipelines, or download our example pipelines and images below:

Human HT29 cells are fairly smooth and elliptical. This pipeline demonstrates how to accurately identify these cells and how to measurements cellular parameters such as morphology, count, intensity and texture. Download (0.4 MB)
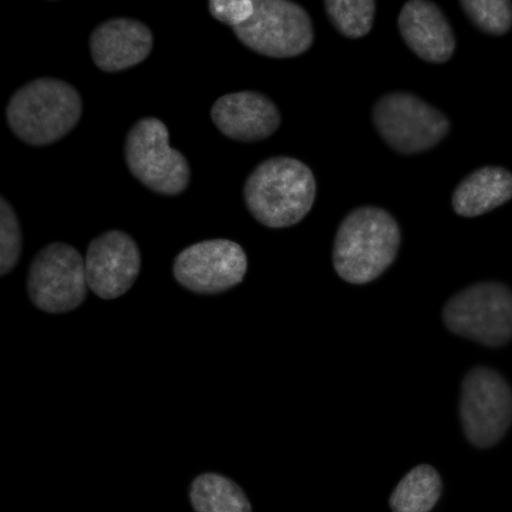
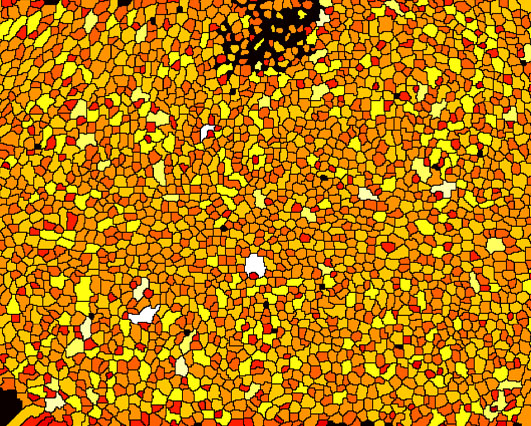
In contrast to the HT29 cells, Drosophila Kc167 cells are a highly textured and clumpy cell type. This pipeline demonstrates how to identify these clumpy cells and obtain morphological, intensity and texture measurements. Download (4 MB)
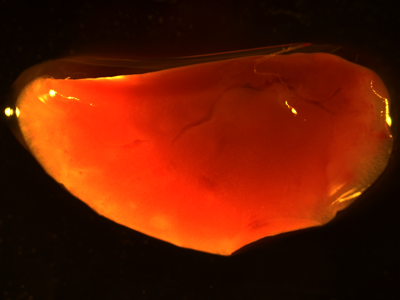

A simple pipeline that identifies and counts tumors in a mouse lung, and then measures their size. Download (0.9 MB)
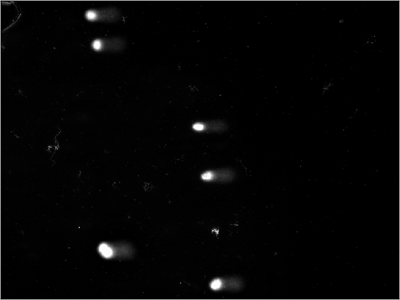
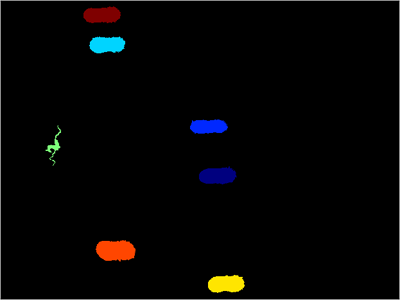
This is a simple example of a DNA damage assay using single cell gel electrophoresis. Here, the measurement of interest is the length and intensity of the comet tail. Also, illumination correction is used to reduce background fluorescence prior to measurement. Also shown is a silver-stained comet example in which the percentage of DNA contained in the tail is calculated. Download (0.4 MB)

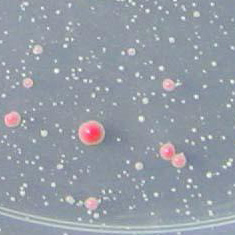
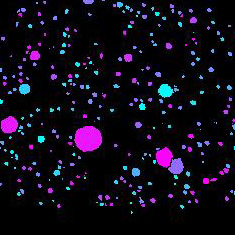
Cell/particle counting and scoring the percentage of stained objects: CellProfiler is commonly used to count cells or other objects as well as percent-positives, by measuring the per-cell staining intensity. This pipeline shows how to do both of these tasks, and demonstrates how various modules may be used to accomplish the same result. Download (0.2 MB)
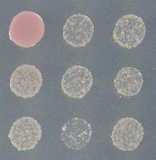
This pipeline demonstrates how to classify and count objects on the basis of their measured features. The example identifies uniformly round objects, in this case, yeast colonies growing on a dish. The pipeline also shows how to load a template and align it to a cropped image, as well as how to use illumination correction to subtract for background illumination. Download (0.6 MB)
Tutorial
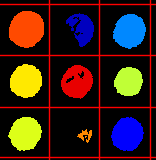
This pipeline identifies patches of yeast growing in a 96 well plate, serving as an introduction to the grid defintion and identification modules. Download (0.5 MB)
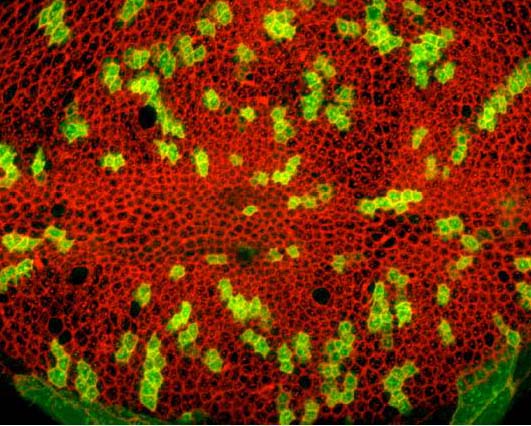
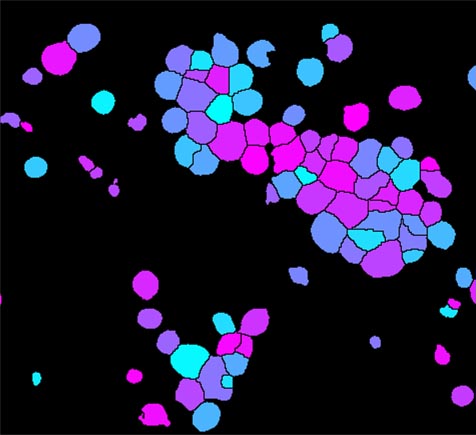
Tissue samples often have irregularly shaped cells with adjacent edges. This pipeline shows how to input a color tissue image, split it into its component channels, and then identify individual cells from a particular stain and record the number of neighbors that each cell has. Download (0.9 MB)

In this example, cells are grown as a tissue monolayer. Rather than identifying individual cells, this pipeline quantifies the area occupied by the tissue sample. Download (1.2 MB)
Illumination correction is often important for both accurate segmentation and for intensity measurements. This example shows how the CorrectIlluminationCalculate and CorrectIlluminationApply modules are used to compensate for the non-uniformities in illumination often present in microscopy images. Download (17.6 MB)Tutorial
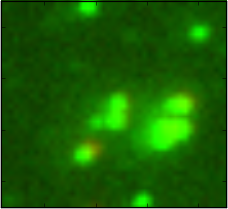
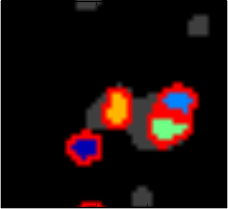
Measuring the colocalization between fluorescently labeled molecules is a widely used approach to measure the degree of spatial coincidence and potential interactions among subcellular species (e.g., proteins). This example shows how the object identifcation and RelateObjects modules are used to measure the degree of overlap between two fluorescent channels. Download (3.9 MB)Tutorial
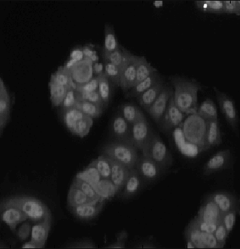

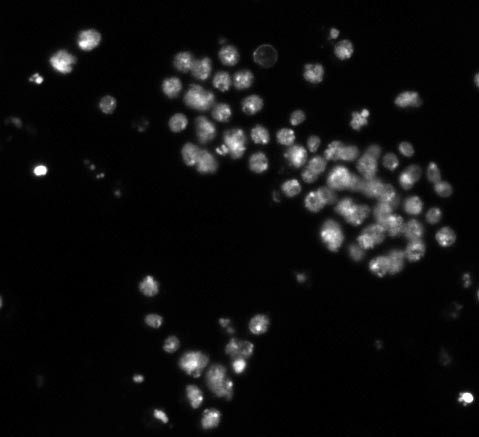
In this human cytoplasm-nucleus translocation assay, learn how to load a previously calculated illumination correction function for two separate channels, measure protein content in the nucleus and cytoplasm, and calculate the ratio as a measure of translocation. This is a clumpy cell type, so studying the settings in primary object identification may be helpful for users interested in the more advanced options that module offers. More about these images can be found at the BBBC. Download (4.4 MB)
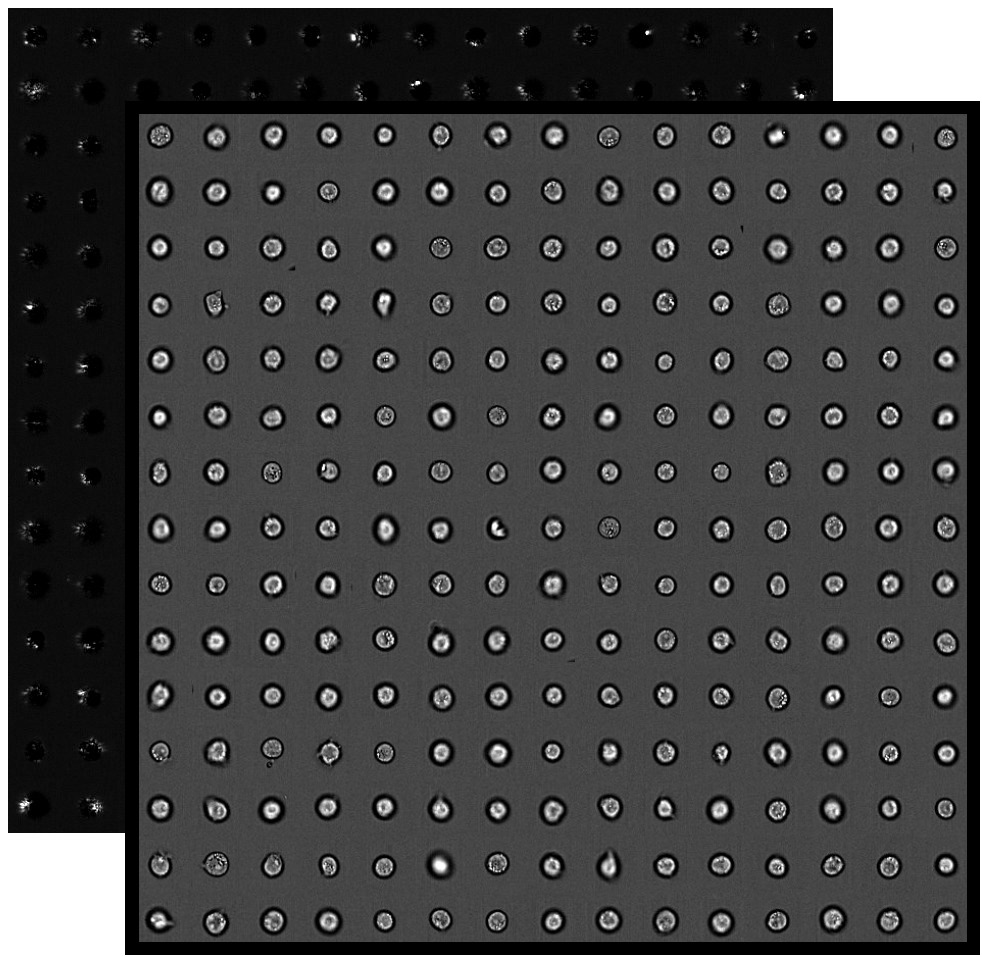
Imaging flow cytometry combines the high-throughput capabilities of conventional flow cytometry with single-cell imaging. CellProfiler can be used to analyze the resulting images from imaging flow cytometry, whether brightfield, darkfield, or fluorescence. The IFC website page has further details on this workflow.
Download (21.2 MB)

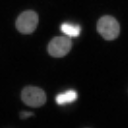
This pipeline shows how to identify smaller objects (foci) within larger objects (nuclei) and how to use the Relate module to establish a relationship between the two as well as perform per-object aggregate measurements (such as number of foci per nucleus). Download (2.7 MB)
This example shows an example of object tracking. This pipeline analyzes a time-lapse experiment to identify the cells and track them from frame to frame, which is challenging since the cells are also moving. In addition, this pipeline also extracts metadata from the filename and uses groups the images by metadata in order to independently process several sequences of images and output the measurements of each. Download (10 MB)
Previous examples (prior to 4.0) can be found on the previous examples page, but we discourage their use because they are now outdated.